Intellectus Statistics’ competitive advantages stem from its focus on providing intuitive UI, flexible pricing models, superior customer service, and thought leadership. These advantages help to differentiate the company from its competitors, including SPSS.
Complexity: SPSS is complex and difficult to learn, especially for students new to statistical analysis. SPSS has a steep learning curve that requires significant time and effort to master. For example, you must learn the tool, what and where the assumptions are located, which charts are associated with analysis, how to format in APA, how to create a create a code book for variables, etc. Intellectus Statistics, on the other hand, provides an intuitive UI simplifying the data analysis process, automates the assumptions and interprets the output in plain English prose.
High Cost: SPSS can be expensive, especially for students who may not have access to institutional licenses or discounts. Intellectus Statistics offers flexible pricing models, including subscription-based options and tiered pricing, which are more affordable and provide greater value for students, faculty, departments, and institutions.
Limited Support: SPSS offers limited customer support, which can be a disadvantage for students and faculty who require additional assistance or guidance in using the software. Intellectus Statistics, however, prioritizes superior customer service and support, and provides personalized consulting and low-cost group consulting services to ensure customer satisfaction and retention.
Thought Leadership: Intellectus Statistics is committed to thought leadership and staying at the forefront of statistical analysis research and trends. This allows the company to provide innovative solutions and insights to customers, and helps establish Intellectus as a leader in the field. For example, to increase transparency and collaboration in research, the Open Science Framework (OSF) has an open-source platform to share data and syntax; Intellectus plans to make available the R-code to make the output reproducible. A second example is new mediation and moderation designs inspired by Preacher and Hayes. Instead of having users find and upload the syntax, then interpret the output, Intellectus does all the heavy lifting with interpreted output and tables for eight common models.
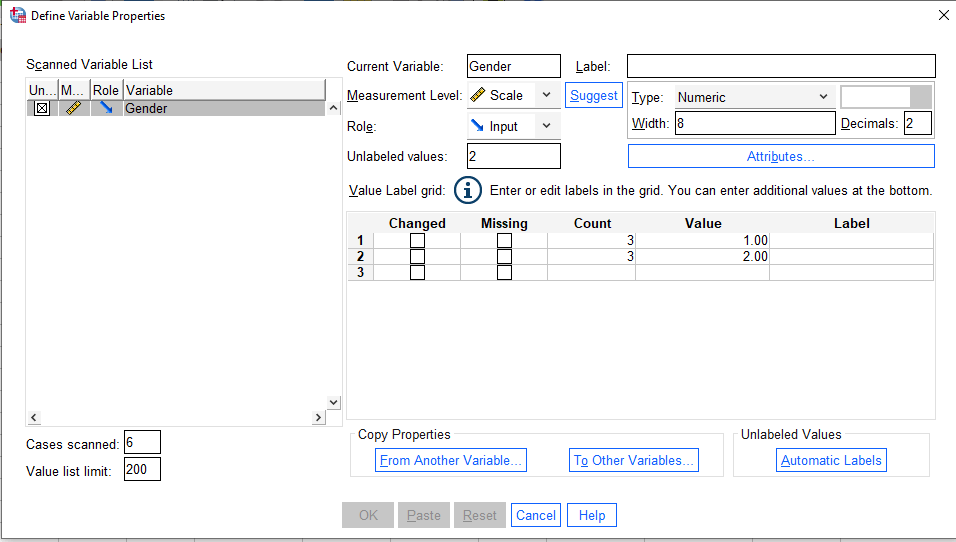
Beginner SPSS users have trouble with fundamental activities like uploading and formatting data, which can cause students to get impatient with the old data analysis tool. In fact, it can take six to eight steps per variable to enter data into SPSS.

Old way using SPSS: The use of coding schemes and codebooks. Let’s consider gender as an example.
- Download your data from an online survey tool or enter it directly.
- Replace the words (male, female, non-binary) with numbers to (male = 0, female = 1, non-binary = 2). The numbers are arbitrary and have no real numeric value…this is an unnecessary task.
- Navigate multiple steps to conduct your analysis, being mindful of the assumptions, etc.
- You get your output…. now what? It’s full of noise. What is appropriate to include in your results sections, why are these tables so messy?
- You start writing up your results, figure out how to create tables in APA 7th, take special care to pull in the correct numbers, and remember which arbitrary numbers you chose as your “codes” to make sure you don’t mix that up.
New way using Intellectus: Skip the coding and codebook with Intellectus.
- Upload to Intellectus or enter it in directly (no coding or renaming necessary).
- Select analysis, click calculate.
- Download your editable word document, complete with APA 7th tables and figures.
You’re all set. You have a draft of your results, assumptions are interpreted, and the tables and findings properly formatted.
Additionally, there are issues with SPSS’s usability, accessibility, interpretability, and formatting. It takes a certain level of statistical competence to choose the suitable quantitative and graphical assumptions when running tests in SPSS. The assumptions must be understood by the user in order to enable them. The majority of SPSS users must download the software, which prevents them from accessing the most recent tests (e.g., built in Preacher and Hayes mediation and moderation models). Students find it challenging to comprehend and present SPSS output. Like many other software programs, SPSS generates a ton of output that is not necessary and that is difficult for non-statisticians to sort through. Additionally, SPSS does not support users who require tables, figures, and references in APA 7th edition style.
Why it matters: The SPSS formatting procedures are tedious, time-consuming, frustrating for users, and antiquated. The manual selection process, which is frequently only available as a download option, reduces the usability of SPSS, and the noisy output makes it difficult to grasp, analyze, and format the results.
Learn More: The issues with SPSS have a remedy from Intellectus Statistics. Variables for the scale are entered as numbers. Nominal and ordinal variables are entered in their original, alpha-numeric form. No codebooks, no coding techniques. Assumptions and output are automated, and the interpreted output is in APA 7th style and plain English prose. Simple, huh?
Learning statistics and conducting quantitative analyses is challenging to most students, leading institutions to look for the best tools available. These institutions also desire a reduced faculty workload which encourages them to conduct more of their own research. Given these objectives, here are five reasons to use Intellectus Statistics as the preferred statistics tool over SPSS: time savings, decreased student learning curve, zero-dollar faculty training costs, efficiency of findings, and an integrated statistics course.
- Time saving. Faculty report saving 40 hours/semester teaching statistics by not having to explain how to navigate SPSS and interpret SPSS output. Additionally, faculty mentors report saving 4.5 hours/ student when overseeing a dissertation or scholarly project. This free time can be spent conducting their own research or taking a COVID mental health break.
- Decreased learning curve. Chen, Moran, Sun & Vu (2018) found Perceived Usability and Ease of Use rating statistically higher for Intellectus compared to SPSS. These participants preferred Intellectus and felt more confident in conducting statistical analysis compared to SPSS. Students and faculty use simple tools.
- $0 training costs. When faculty and departments adopt Intellectus, faculty training is free. We review faculty’s syllabus with them and ensure they are comfortable with uploading, conducting, and interpreting the output, as well as using the built-in decision tree, data plans, and power analysis. Faculty development is totally free.
- Efficiency of findings. Intellectus Statistics is not only easier to use, rigorous in its analyses, but the tool leverages technology to format the findings in APA 7th style—tables, figures, & references. The technology allows the drafting of findings 10x more quickly than SPSS. Further, the combination of automated assumptions and interpreted Autodrafted results ensure rigor is part of their research findings. With these efficiencies, faculty conduct more research.
- Integrated statistics course. Intellectus provides the Stats 1 Course option—an online, 9 module (50 lesson) interactive statistics course offering an e-text, embedded videos, practice, quizzes, and online assessment with auto-grade return. Students will not only learn how and why to conduct tests, but how to accurately interpret statistical output. Intellectus’ complete solution results in better student learning.
While there are way more than 5 reasons to use Intellectus, overall it frees-up faculty time, makes the learning of statistics easier, reduces frustration, and provides the teaching of statistics in an integrated, seamless process. To learn more about benefits of Intellectus, please contact us.
*Note. IBM’s SPSS is not literally free. Given an institutional purchase, SPSS typically does not directly affect a department’s budget, so it is occasionally perceived as “free” at the department level.
Reference
Chen, A.C., Moran, S., Yuting Sun, Y., & Vu, K.L. (2018). Comparison of Intellectus Statistics and Statistical Package for the Social Sciences Differences in User Performance based on Presentation of Statistical Data. Proceedings of the 2018 Human Computer Interaction International conference. DOI: 10.1007/978-3-319-91122-9_32
Can There Be Too Much Interpretation?
Let’s face it, not all students and faculty are statisticians, nor do they want to be. However, students must still learn the ins and outs of statistical analyses. This means understanding terms and symbols and learning to conduct and interpret the output. SPSS offers a steep learning curve for many. The program can seem clunky and intimidating, and the output includes too much noise. This can interfere with students deciphering the signal. Intellectus Statistics exists to overcome these challenges. However, some faculty worry that too much interpretation may hinder students learning of statistics.
Faculty want their students to turn raw output into written results. But where do students learn to write? Some faculty provide journal articles with written results while some use examples from textbooks. Intellectus’ AutoDrafting technology is simply another way to exemplify how to interpret and report quantitative results.
How to integrate Intellectus into statistics learning
When teaching statistics to students, use the “whole picture, then practice, practice, practice” approach. Students need to see the whole picture of an analysis and the reporting. These pieces include an introduction to the analysis, the correct assumptions conducted and interpreted, the analysis interpreted with recommendations to retain or reject the null hypotheses, the appropriate tables and figures for that analysis, and in-text citations and references. This is precisely what Intellectus provides under the interpreted output view. The first step to acquiring statistical competence is to let Intellectus show students the whole picture of that analysis. Below is an interpreted output view of a paired t-test.
Two-Tailed Paired Samples t-Test: Interpreted Output View
Introduction
A two-tailed paired samples t-test is conducted to examine whether the mean difference of Knowledge Pretest and Knowledge Posttest is significantly different from zero.
Assumptions
Normality. A Shapiro-Wilk test is conducted to determine whether the differences in Knowledge Pretest and Knowledge Posttest could have been produced by a normal distribution (Razali & Wah, 2011). The results of the Shapiro-Wilk test are significant based on an alpha value of 0.05, W = 0.90, p < .001. This result suggests the differences in Knowledge Pretest and Knowledge Posttest are unlikely to have been produced by a normal distribution, indicating the normality assumption is violated.
Homogeneity of Variance. Levene’s test is conducted to assess whether the variances of Knowledge Pretest and Knowledge Posttest are significantly different. The result of Levene’s test is significant based on an alpha value of 0.05, F(1, 98) = 15.86, p < .001. This result suggests it is unlikely that Knowledge Pretest and Knowledge Posttest are produced by distributions with equal variances, indicating the assumption of homogeneity of variance was violated.
Results
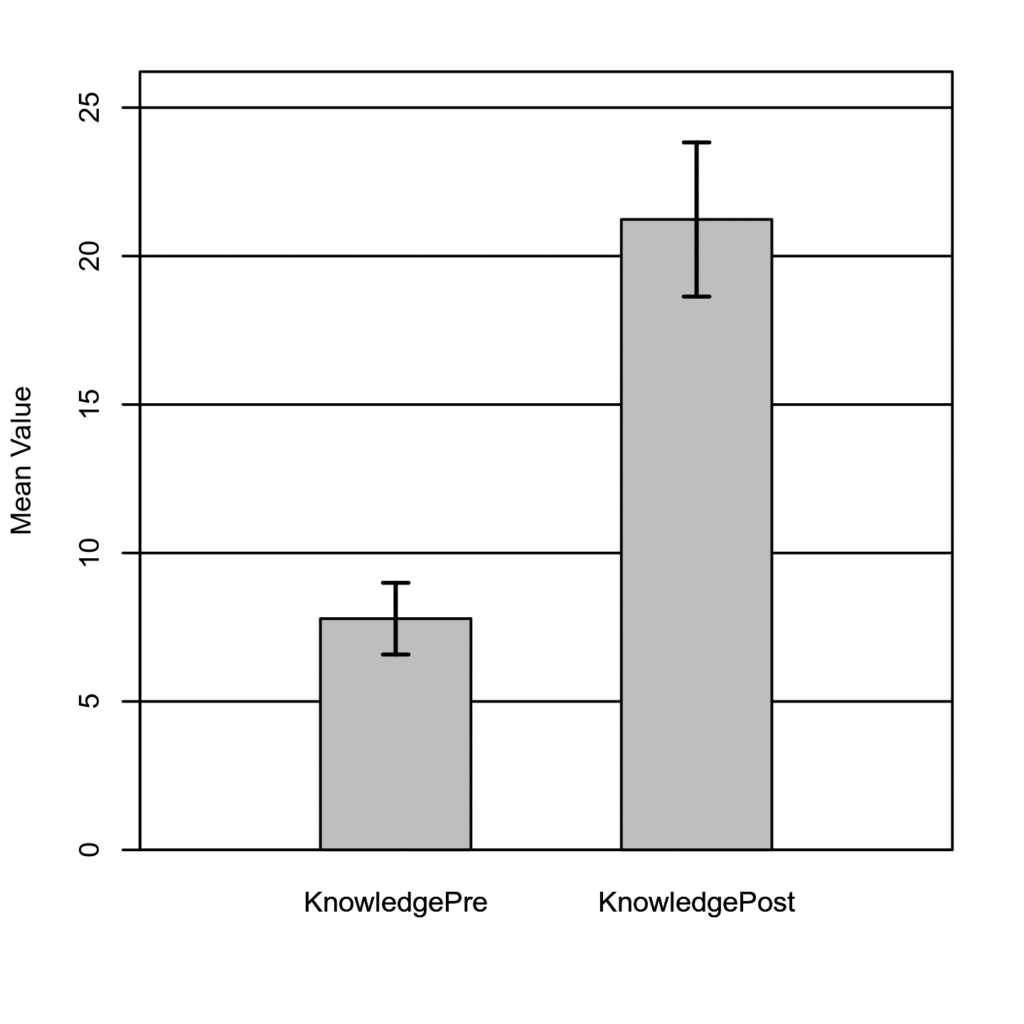
The result of the two-tailed paired samples t-test is significant based on an alpha value of 0.05, t(49) = -12.20, p < .001, indicating the null hypothesis can be rejected. This finding suggests the difference in the mean of Knowledge Pretest and the mean of Knowledge Posttest is significantly different from zero. The mean of Knowledge Pretest was significantly lower than the mean of Knowledge Posttest. Find the results in Table 1 and a bar plot of the means in Figure 1.
Table 1
Two-Tailed Paired Samples t-Test for the Difference Between Knowledge Pretest and Knowledge Posttest

Note. N = 50. Degrees of Freedom for the t-statistic = 49. d represents Cohen’s d.
Figure 1
The means of Knowledge Pretest and Knowledge Posttest with 95% CI Error Bars

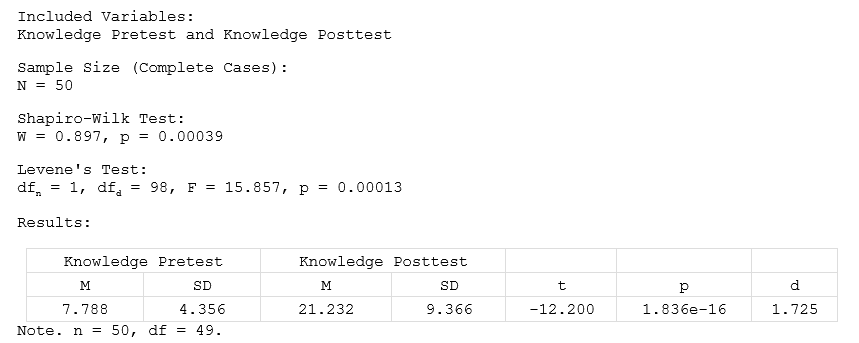
The next step is to take the same statistical test with different data and provide students with only the raw output view. The students must then interpret and write-up the results, create the appropriate tables and figures, and reference the assumptions. Below is the raw output view of a paired t-test.
Two-Tailed Paired Samples t-Test: Raw Output View
Paired t-Test for Knowledge Pretest and Knowledge Posttest

The students can then independently do a knowledge check by comparing their write-up to the interpreted output view and edit as necessary. Faculty can use the numerous datasets to allow the students to practice, practice, practice.
Intellectus Statistics and its Autodrafting technology offer a different mode of learning and teaching. Students who use Intellectus are much less frustrated when they see that an analysis includes easily digested data. They gain the skill of writing the results themselves as well as the competence and confidence to conduct data analyses without being a statistician.
“Intellectus was clearly a data analysis tool that was superior to other options available. Faculty feedback included significant time savings and less frustration with repetitive corrections of the same programming mistakes. The use of Intellectus supported the growth and development of nurse practitioners with competencies in the skills necessary for the development of evidence-based practice. This year we are using Intellectus in our entry level graduate statistics class as well as expanding its inclusion in our upper division research courses, including the graduate projects. We have been very happy with the results.”
Elizabeth Heavey, PhD, RN, CNM
Graduate Program Director and Professor, Department of Nursing, College of Brockport, SUNY
Author, “Statistics for Nursing: A Practical Approach, 3rd ed.
Click the button below to schedule a demo to learn more.
Proprietary Technology: Rigor and Accuracy
Intellectus Statistics’ proprietary software has a different approach to learning statistics and conducting data analyses that offer support to DNP students completing scholarly projects. Built-in assumptions assures that rigor in included in every analysis. The Autodrafting technology analyzes the output, delivering an interpretation that is accurate, in plain English prose, and in APA 7th edition style.
Scholarly-Practitioner Projects
DNP students using Intellectus complete their scholarly projects with much more ease and by a magnitude of (10x) faster. The tool was created for the non-statistician, scholar-practitioner. APA 7th edition results, built-in videos, user manual, group consulting, glossaries, and scroll-overs provide all the mission-critical support needed to analyze data effectively and efficiently. Students graduate with the ability to conduct and consume research.
Published Work and Institutional Customers
Several hundred scholarly projects, and scores of nursing research in peer-reviewed articles, have used Intellectus as their data analytic tool. Over 110 universities and more than 43,000 students and faculty are using Intellectus Statistics. The universities range from Arizona State University to University of Maryland.
I recently came across Malcom Gladwell’s David and Goliath story, and I couldn’t help but think of the fight that Intellectus Statistics is having with taking on IBM’s SPSS. In Gladwell’s version of the story, he lays out that giants often have a tumor grow on their pituitary gland that is associated with vision impairment. In his telling, Goliath maybe couldn’t see a few feet in front of him. For David’s part, he had a sling that, when used well, achieved the speed of a 45-caliber bullet.
Analogously, big companies like IBM have vulnerabilities such as “I don’t have to adapt.” They have a failure of empathy of what students go through in learning statistics. Meanwhile, underdogs like Intellectus Statistics have the characteristics of success; as Gladwell says, underdogs are “nimble, driven by entrepreneurial ideas, motivated, persistent, excited, and have faith.” Further, Intellectus Statistics is driven by “the spirit of technology” (using the popular R-program and wrapping with features that students need), and we continue to adapt that technology to create a practical statistical tool that meets the needs of our users.
SPSS has been around for over 60 years and yet they have not adapted to obvious student needs. These needs include an easy platform to navigate, guidance on assumptions of analyses, and support to interpret the output. Conversely, Intellectus made their tool intuitive with scroll overs that help students navigate and select the appropriate analyses. Statistical test assumptions are not only automatically run with each test, but the assumptions are interpreted, and non-parametric tests are suggested when assumptions are violated. The output is interpreted in plain English prose with recommendations to accept or reject the null hypotheses, and then that prose is presented in APA 7th edition style.
Intellectus Statistics has been innovating for 8 years, adding support like 70 built-in videos, interactive textbook, curated glossaries, and in-depth user manual. We understand what students need to learn statistics and rigorously conduct and interpret their analyses. Intellectus’ employees put the effort into introducing the tool, outwork their SPSS counterparts, and are committed to making real their idea of providing students a practical tool to conduct and report statistical analysis.
James Lani, PhD | CEO Intellectus Statistics
Why do higher education programs, and faculty, use SPSS? What is the intrinsic value? Most students are taught to use SPSS as a tool to analyze data in the examining of their research question. The amount of time spent learning the tool is crazy steep. For example, if you YouTube SPSS, you’ll find that 962,316 individuals searched SPSS Introduction. Why make it difficult to analyze data when smarter, better fit SPSS alternatives exist?
Intellectus Statistics is an SPSS alternative used to analyze data and examine research questions without the large learning curve. Intellectus’ AutoDrafting technology preloads assumptions, interprets the assumptions and analyses in plain English sentences, makes recommendations, then presents the output, including tables and figures, in APA 7th format.
When faculty reevaluate their basic assumptions when selecting a tool, and ask the question of “Why?” they are teaching and using SPSS instead of technologically advanced alternatives, they will substitute their statistics tool. At the end of the day, Intellectus Statistics will provide students with a data-analytic tool to meet their needs, their data will be rigorously analyzed, and students can quickly appreciate the meaning in the data without the learning curve.
“How do I drive students to successful learning?” is a question confronting educators, from provosts, deans, department chairs, to faculty. When combined with moving learning online, using technologies, and adding a challenging subject like statistics, driving students to success becomes an obstacle course.
Intellectus Statistics AutoDrafting technology analyzes data and automatically generates a written interpretation of statistical output for students. The technology can help students and instructors navigate the learning and teaching of statistics by building bridges over knowledge gaps, accelerating learning by reducing cognitive loads for novices, and avoiding putting the brakes on learning with embedded support throughout the journey.
Scaffolding Designs for Novice Learners
Learning differs between novices and experts. Novices depend on concept formation, whereas experts use concept integration (Daley, 1999). Concept formation is accelerated by guiding learners through step-by-step tasks that illustrates and demonstrates how components of statistical analysis become integrated.
Intellectus’ AutoDrafting technology facilitates concept formation through step-by-step guidance and examples of how to conduct and understand statistical analyses and interpretations. By comprehensively including the components of an analysis in the output, including automated interpreted assumptions, automated interpreted output in plain English narrative, automatically generating appropriate tables and figures, as well as presenting worked-through examples of how the findings and tables are reported. Intellectus creates conceptual landmarks for the novice learner’s journey where there are gaps in students’ knowledge. Intellectus also provides context-sensitive help that can bridge the knowledge gaps and drive them to the solution. Together, these features allow novice students to form the concept of how data analyses are conducted, what they mean, and how they are written.
Managing Cognitive Loads
Being overwhelmed is a common obstacle for novices learning statistics. With so many new concepts, mixing with some less-than optimal math skills, novices cannot organize their learning into meaning chunks/concepts. According to Cognitive Load theory (Sweller, 1988), there are three types of cognitive load: intrinsic load (task complexity), extraneous load (features that are not beneficial for learning), and germane load (features that are beneficial for learning). Novice learners learn better from worked examples (Cooper & Sweller, 1987; Paas & Van Merriënboer, 1994; Sweller & Cooper, 1985) by reducing task complexity on intrinsic load. Intellectus reduces task complexity with a simple user-interface, useful default settings, and fully worked examples. Extraneous load is minimized by stripping away irrelevant options and unnecessary, confusing output; Intellectus only provides information relevant for presentation and understanding. Germane load is enhanced in Intellectus by providing instructional features such as scroll-overs that immediately explain statistical figures, terms, and symbols. Intellectus manages these cognitive load types in a way that optimizes cognitive resources.

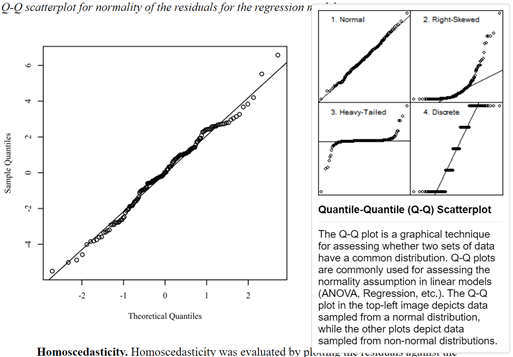
To the left is a linear regression Q-Q scatter- plot, automatically generated in the output, to assess normality.
The right side of the image shows the scroll-over to help students decide whether the data is from a normal distribution.
Supporting Retention
Repetition and meaning are keys to long-term memory. For example, introduction to statistics terms just once is subject to primacy and recency effects, while seeing terms a third time increases the retention of structurally important information. Increased repetition allows for important information to be remembered (Bromage & Mayer, 1986). Intellectus’ built-in datasets, textbook, and videos provide novices numerous complete examples. These examples produce and explain relevant terms and symbols that provide meaningful encoding and retrieval opportunities, and champions retention and understanding.
Synergizing Accelerators
Intellectus accelerates statistics learning by supporting students’ ability to form statistical concepts, managing cognitive load, and promoting retention opportunities. To learn more about Intellectus Statistics click here.
References
Bromage, B. K., & Mayer, R. E. (1986). Quantitative and qualitative effects of repetition on learning from technical text. Journal of Educational Psychology, 78(4), 271–278. https://doi.org/10.1037/0022-0663.78.4.271
Cooper, G., & Sweller, J. (1987). Effects of schema acquisition and rule automation on mathematical problem-solving transfer. Journal of Educational Psychology, 79, 347–362.
Daley, B.J. (1999). Novice to Expert: An Exploration of How Professionals Learn. Sage Journals, Vol 49 (4), 133-147. https://doi.org/10.1177/074171369904900401
Paas, F., & Van Merriënboer, J. J. G. (1994). Variability of worked examples and transfer of geometrical problem-solving skills: A cognitive-load approach. Journal of Educational Psychology, 86, 122–133.
Sweller, J. (1988). Cognitive load during problem solving: Effects on learning. Cognition Science, 12 (2), 257–285. https://doi.org/10.1207/s15516709cog1202_4
Sweller, J., & Cooper, G. A. (1985). The use of worked examples as a substitute for problem solving in learning algebra. Cognition and Instruction, 2, 59–89.