Intellectus Statistics Meets School Administrator and Graduate Students Data Analyses and Report Writing Needs
Category
Educational Technology
Introduction
Over decades of statistical consulting, school administrators and graduate students consistently needed comprehensive quantitative analyses and quality reports without having to be statisticians. They needed the right tool to support their data management, selection of analyses, and understanding of the findings.
Market Drivers
These individuals have a clear idea of their variables, research questions, and they need answers quickly. They need answers without having to have a degree in statistics. While their need for an easy to use program is great, the technology has not been available. Given limited staff, and time, to conduct analyses, they need a program that delivers a presentation-ready document with descriptive and sophisticated analyses, along with publication quality graphics.
Intellectus Statistics’ Solution
Intellectus Statistics is a technological innovation. This package is easy to use, allows for data management, offers common plots, interprets output in plain English, and downloads into Word. Intellectus also comes with live support of a statistician should additional questions about data plans, sample size, using the program, and understanding the output arise.
Benefits
One benefit of Intellectus is in its automation. The software has built-in “skills.” For example, when an analysis is selected, the assumptions of that analysis is preloaded, if assumptions are violated, the non-parametric equivalent is automatically conducted. Appropriate tables and figure are automatically produced. The program guides you to use the right variables in the right analysis.
Time savings in the second big benefit of Intellectus. Many projects that typically take 2 weeks can be accomplished within 2-hours. This is accomplished because the program drafts the findings in English sentences in seconds. This helps administrators and students make decisions about their analysesquickly.
Money is the third big benefit. School districts’ administrators and students don’t have to hire out statisticians to conduct, interpret, and draft findings—it’s all part of the program.
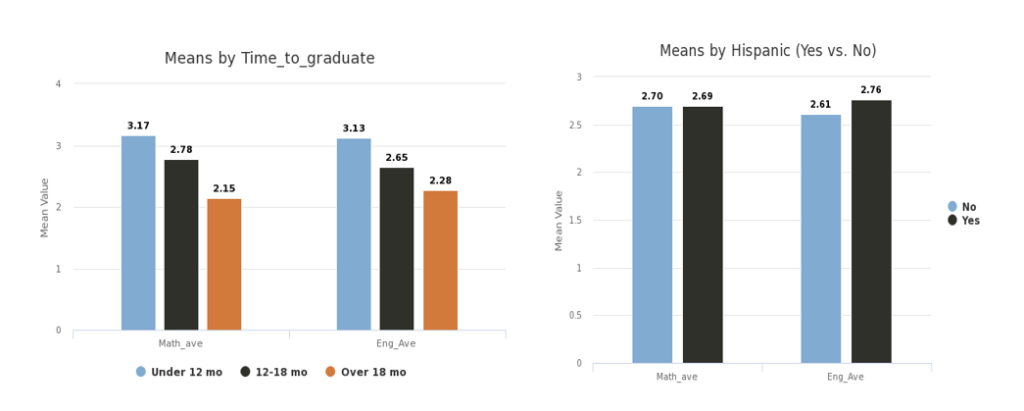
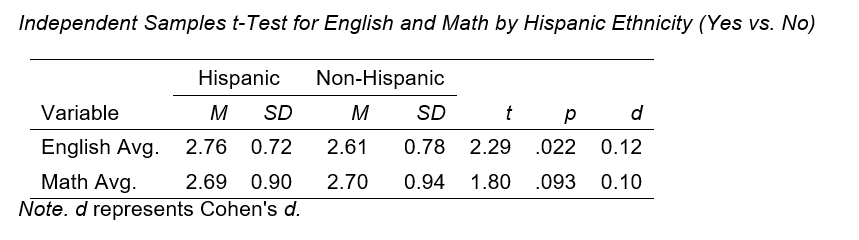
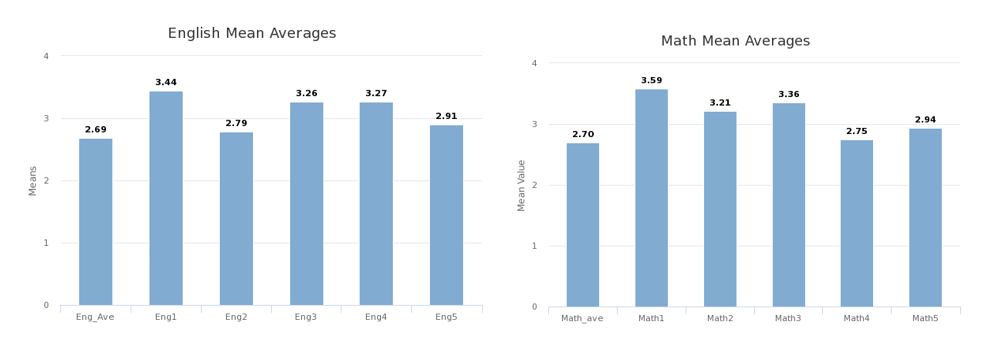
Case study 1: Grant recipient Needed Analyses and Figures. A grant recipient sought to describe English and Math scores of their institution and examine these scores by ethnicity and time to graduate. In less than 5 minutes, the following figures and analyses were generated.
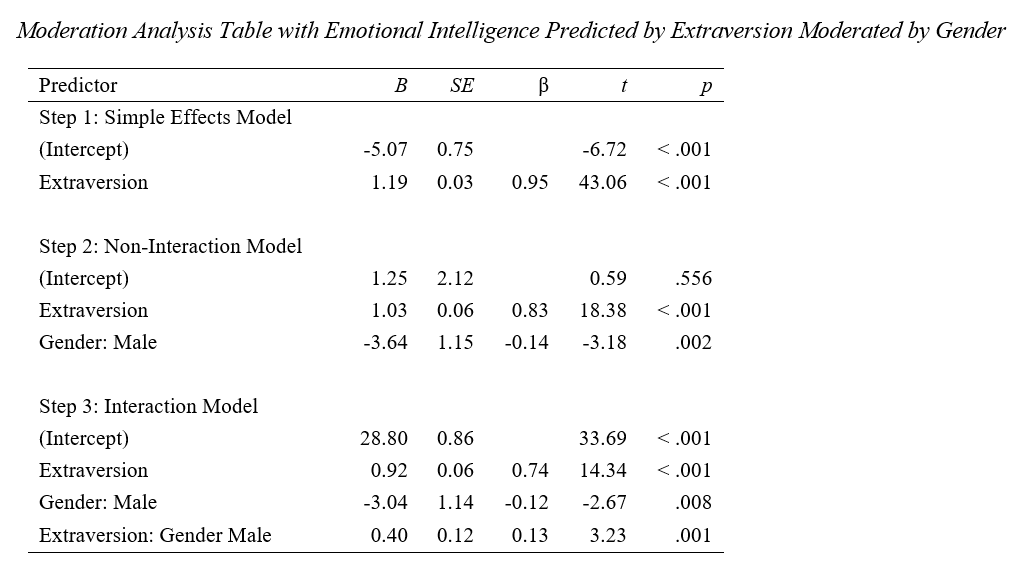
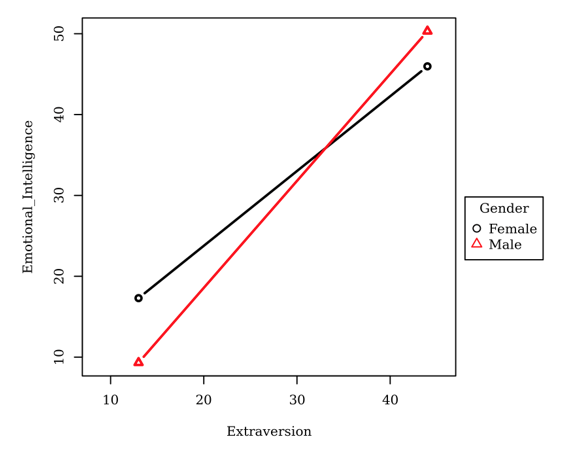
Case study 2: Doctoral Candidate Needed a Moderation Analysis. A dissertation student sought to examine whether gender moderated the relationship between Extraversion and Emotional Intelligence.
The following verbiage, table, and figure were generated in seconds.
“…Since Extraversion significantly predicted Emotional Intelligence in the simple effects model (condition 1) and the interaction model explained significantly more variance of Emotional Intelligence than the non-interaction model (condition 2), then moderation is supported…This suggests that moving from the Female to Male category of Gender will cause a 0.40 increase in the slope of Emotional Intelligence on Extraversion….”
Intellectus—SPSS Comparison
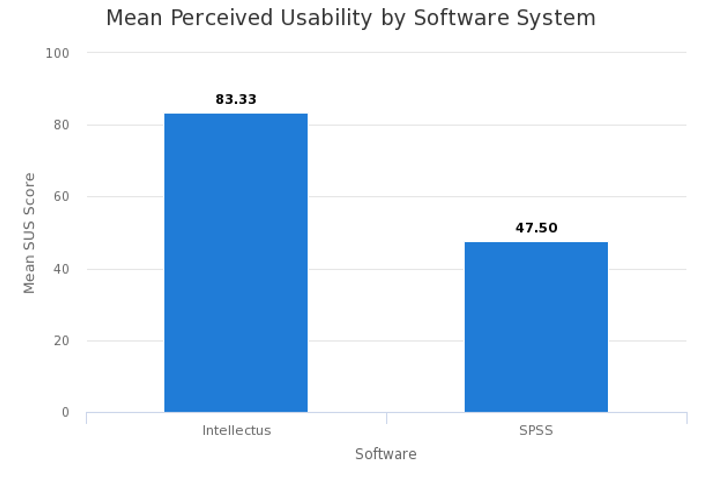
A 2015 study (Orfanou, Tselios, and Katsanos, 2015) reported that “perceived usability greatly affects students learning effectiveness and overall learning experience.” The System Usability Scale (SUS) is a widely used, well-researched survey for perceived usability evaluation. The SUS is a self-reported 10-item Likert scale questionnaire that measures overall perceived reliability. Bangor, Kortum, and Miller (2008) cited SUS as a highly robust tool for measuring perceived usability. The perceived usability scores range from zero to 100, where scores under 50 indicate unacceptable usability, 51 to 70 indicate marginal acceptability, and scores above 70 indicate acceptable usability (Albert, W., & Tullis, T, 2013).
In a recent study, Chen, Moran, Sun, and Vu (2018) compared SPSS to Intellectus Statistics (IS) overall Perceived Usability using the SUS scores. The findings indicated that participants rated IS significantly more usable compared to SPSS. The SUS scores for IS level of usability (M = 83.33, SD = 11.74) is considered acceptable, while the SUS scores for SPSS (M = 47.50, SD = 15.67) were statistically lower and considered unacceptable.
Conclusion
The goal is to enable every school administrator and graduate student to easy conduct analyses and have a deeper understanding of findings. Intellectus is a breakthrough technology that automates processes, saves time in drafting findings, saves money in outsourcing work, and has very high perceived usability.
Intellectus is Latin for comprehension. Intellectus Statistics is designed to support understanding, where administrators and students can make decisions from their data analyses in seconds.
References
Albert, W., & Tullis, T.: Measuring the user experience: collecting, analyzing, and presenting usability metrics. Newnes (2013).
Bangor, A., Kortum, P. T., & Miller, J. T.: An empirical evaluation of the system usability scale. Intl. Journal of Human–Computer Interaction, 24(6), 574-594 (2008).
Chen, A.C., Moran, S., Yuting Sun, Y., & Vu, K.L. (In press). Comparison of Intellectus Statistics and Statistical Package for the Social Sciences Differences in User Performance based on Presentation of Statistical Data. Proceedings of the 2018 Human Computer Interaction International conference.
Konstantina Orfanou, K., Tselios, N., & Katsanos, C. (2015). Perceived Usability Evaluation of Learning Management Systems: Empirical Evaluation of the System Usability Scale. The International Review of Research in Open and Distributed Learning (Vol 16, No.2).