Empowering Learning and Research in Statistics with Intellectus Statistics:
A Feature-Rich Software Application
Intellectus Statistics is a software application that aims to facilitate the process of learning statistics and conducting research. It offers a user-friendly interface and a range of features that enable users to efficiently acquire statistical knowledge and apply it in their research endeavors. Among its key features are the provision of plain-English interpretations of statistical output, automatic generation of tables and figures in accordance with the APA 7th edition guidelines for over 60 statistical tests, context-sensitive help to address knowledge gaps, video tutorials, and intuitive navigation. These functionalities are aimed at making the process of learning statistics and conducting research more manageable and accessible for users.
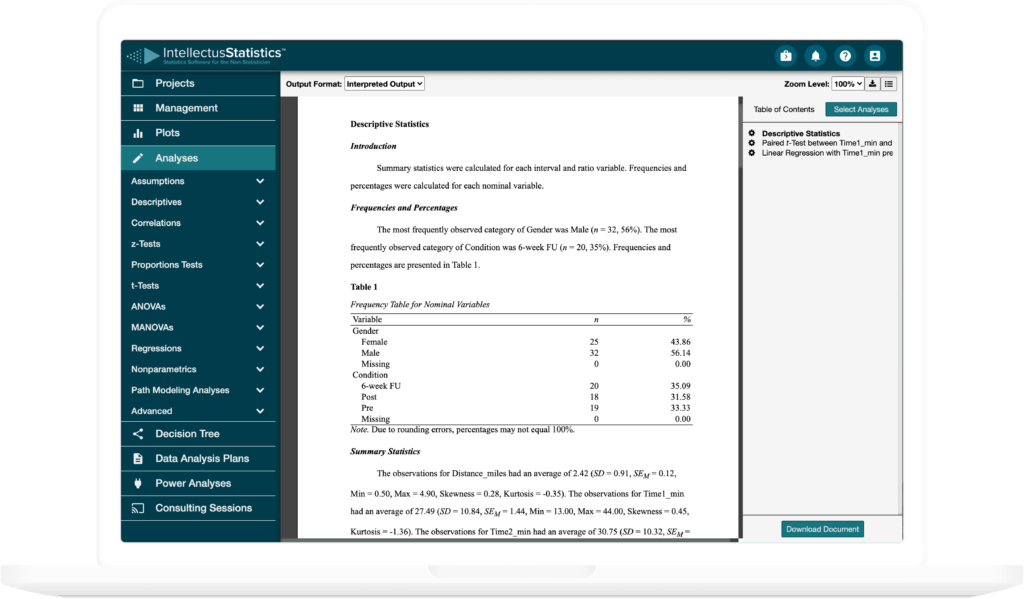
Narrative Interpreted Quantitative Results
With a few clicks, download a natural-language interpreted output in a fully editable, APA 7th edition formatted Word document, complete with APA tables, figures, and references. This output ensures that each test is accurately interpreted while omitting the time-consuming burden of formatting tables and streamlining the research process.
Powerful statistical techniques
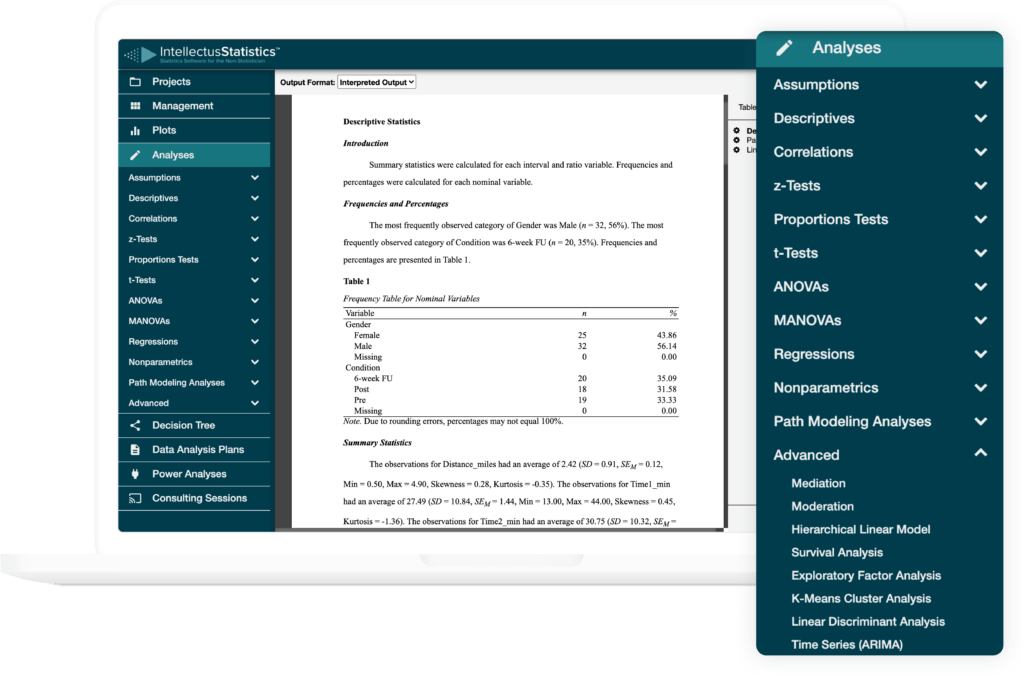
Intellectus Statistics is built on the powerful R programming language, which allows for seamless data importation, management, and analysis. This software facilitates the integration of various file types, such as Excel, SPSS, and SAS, as well as manual data entry. Additionally, it offers an extensive range of data visualization options, including the ability to generate control charts with interpreted output, to help users better understand their data.
Intellectus also provides a wide variety of statistical analysis methods, including descriptive statistics (e.g. cross tabulation, frequencies, means), bivariate statistics (e.g. t-tests, ANOVA, correlations, non-parametric analyses), prediction modeling (e.g. linear regression, logistic regression), group identification (e.g. discriminant analysis, factor analysis, cluster analysis), structural equation modeling, confirmatory factor analysis, and survival analysis, which allows for the evaluation of complex research questions. The integration of these advanced statistical techniques in a single user-friendly platform makes Intellectus Statistics an invaluable tool for researchers and statisticians alike.
Effective Learning and Teaching of Statistics: A User-Friendly Interface and Advanced Teaching Features
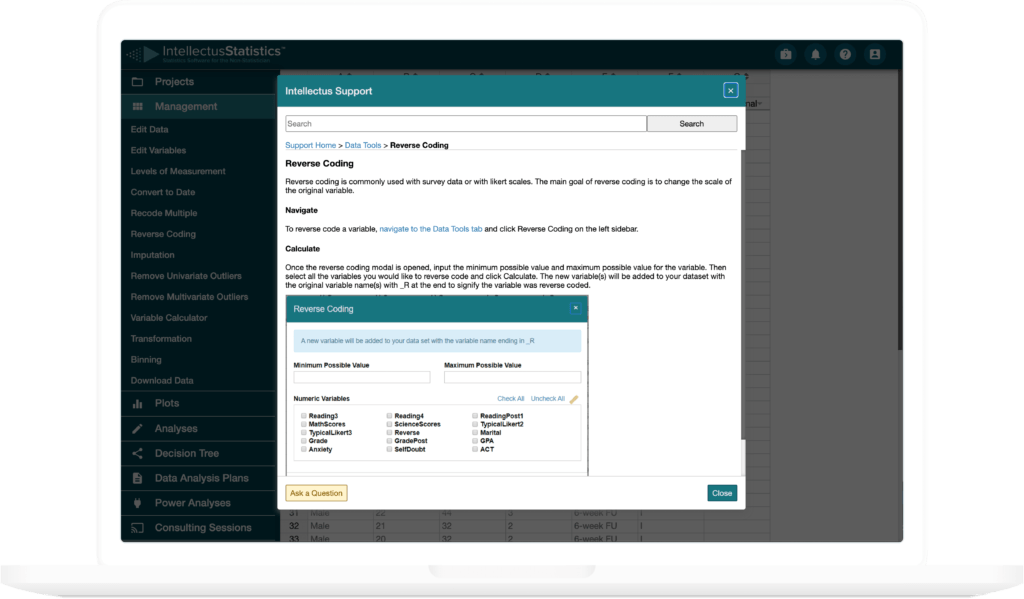
Every data management task, plot, and analysis has a “tutorial” button. These tutorials guide users through that data analysis task. Intellectus Statistics is a better way to teach statistics as well as a student time-saver. The software also offers a range of advanced features that help to streamline the process of learning statistics and conducting research such as auto-filling assumptions associated with each analysis, automatically dummy-coding variables, and providing post-hoc tests and interpretation of these assumptions that analyses require.
Intellectus also offers several tools to effectively teach statistics. This includes user-interface reminders for defining the level of measurement of variables, scroll-overs that provide reminders of the purpose and functionality of statistical techniques, and a custom glossary of terms and symbols for each statistical test performed, which improves students’ understanding of the subject and saves time for both faculty and students.
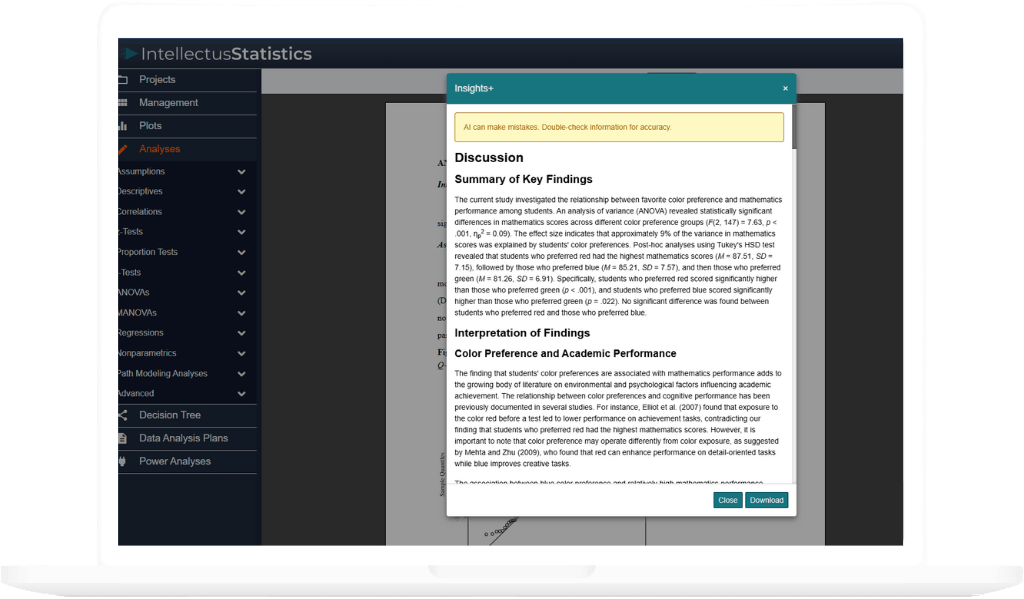
Insights+: Results-Based AI-Assisted Discussion Chapter for Academic Research
Insights+ is the first AI tool built specifically to help students and faculty write academic discussion chapters using their quantitative results. After statistical analysis is complete, Insights+ takes the blank page off your hands—delivering a structured, literature-integrated draft in minutes. Developed with academic writing in mind, it synthesizes findings, integrates scholarly sources, discusses implications, and even generates future research directions.
Designed as a springboard—not a shortcut—Insights+ helps researchers focus on critical thinking and refinement, not formatting and structure. Whether you’re a student stuck in writing paralysis or a faculty member stretched thin by mentoring, Insights+ transforms the discussion-writing process from a 14-week grind into a short path to clarity, insight, and stronger scholarship.
Emphasizing Ease of Integration, Data Privacy and Security, and Accessibility
Intellectus Statistics takes ease of integration, data privacy and security, and accessibility, seriously. Intellectus Statistics places a strong emphasis on the principles of ease of integration, data privacy and security, and accessibility. The software has been designed with an explicit focus on ensuring that these critical aspects are thoroughly considered and implemented throughout its architecture and functionality. This attention to detail serves to ensure that the software can be easily integrated into existing workflows and environments, that the data of users is kept safe and secure, and that it is accessible to as wide a range of users as possible.
Data Classification and De-identification: Intellectus Statistics’ Policy on Protected Health Information (PHI)
It is important to note that the services offered by our organization are of a general nature and are not equipped to distinguish or categorize any information that is processed or stored as Protected Health Information (PHI) or any other specifically defined data type. Any processing of data that may fall under such classification is not a necessary component of utilizing our services. To this end, we strongly recommend that any data of a sensitive nature be de-identified prior to being uploaded for use with our services. In accordance with the HIPAA Privacy Rule, de-identified information is no longer considered PHI and thus, is not subject to the same regulatory restrictions and limitations. Click here for further information on the process of de-identifying data.
Accessibility
We’ve made Intellectus Statistics accessible to those with disabilities by complying with Section 508 of the Rehabilitation Act (29 U.S.C. § 794d). We accomplish this by ensuring our most critical services meet the Web Content Accessibility Guidelines 2.0 and that our features follow its three principles.
You can view our Voluntary Product Accessibility Template (VPAT) here.
Intellectus’ accessibility uses the WAI-ARIA attributes extensively to allow screen readers to announce content to users. Special attention includes keyboard navigation in many places. For example, in the data editor we’ve made sure keyboard-only users can quickly escape the spreadsheet rather than having to potentially tab through hundreds of cells.
If you’d like to learn more about integrating Intellectus Statistics into your institution, or have questions about policies on this page, please contact us at [email protected].
Intellectus Statistics: A research and instructional platform
Intellectus is more than a research platform; it was designed as a student-centered, instructional platform too. Support for the platform includes free faculty training, optional daily group consulting, and a free Intellectus handbook.
Complete Feature List
Contact us today
Available Analyses
Powered by R, Intellectus Statistics’ tests range from the simple to the complex, all with the simple ease-of-use, automatically generated assumptions, APA 7th edition tables and figures, and output interpreted in plain English narrative. All of the analyses have a curated set of how-to videos and glossary for each test conducted.
The data visualization options are equally broad, easy-to-use, and print-ready. Intellectus’ plots had users in mind in their creation. For example, correlations accompany scatterplots, and control charts have interpreted output for seven different rulesets.