A New Mode of Learning Statistics
Category
Course Integration
Can There Be Too Much Interpretation?
Let’s face it, not all students and faculty are statisticians, nor do they want to be. However, students must still learn the ins and outs of statistical analyses. This means understanding terms and symbols and learning to conduct and interpret the output. SPSS offers a steep learning curve for many. The program can seem clunky and intimidating, and the output includes too much noise. This can interfere with students deciphering the signal. Intellectus Statistics exists to overcome these challenges. However, some faculty worry that too much interpretation may hinder students learning of statistics.
Faculty want their students to turn raw output into written results. But where do students learn to write? Some faculty provide journal articles with written results while some use examples from textbooks. Intellectus’ AutoDrafting technology is simply another way to exemplify how to interpret and report quantitative results.
How to integrate Intellectus into statistics learning
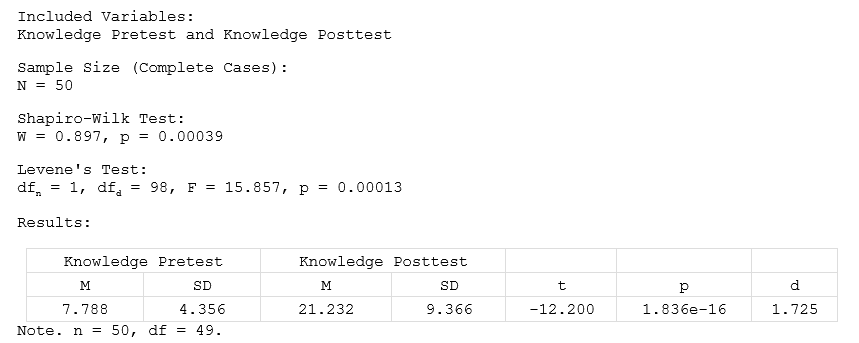
When teaching statistics to students, use the “whole picture, then practice, practice, practice” approach. Students need to see the whole picture of an analysis and the reporting. These pieces include an introduction to the analysis, the correct assumptions conducted and interpreted, the analysis interpreted with recommendations to retain or reject the null hypotheses, the appropriate tables and figures for that analysis, and in-text citations and references. This is precisely what Intellectus provides under the interpreted output view. The first step to acquiring statistical competence is to let Intellectus show students the whole picture of that analysis. Below is an interpreted output view of a paired t-test.
Two-Tailed Paired Samples t-Test: Interpreted Output View
Introduction
A two-tailed paired samples t-test is conducted to examine whether the mean difference of Knowledge Pretest and Knowledge Posttest is significantly different from zero.
Assumptions
Normality. A Shapiro-Wilk test is conducted to determine whether the differences in Knowledge Pretest and Knowledge Posttest could have been produced by a normal distribution (Razali & Wah, 2011). The results of the Shapiro-Wilk test are significant based on an alpha value of 0.05, W = 0.90, p < .001. This result suggests the differences in Knowledge Pretest and Knowledge Posttest are unlikely to have been produced by a normal distribution, indicating the normality assumption is violated.
Homogeneity of Variance. Levene’s test is conducted to assess whether the variances of Knowledge Pretest and Knowledge Posttest are significantly different. The result of Levene’s test is significant based on an alpha value of 0.05, F(1, 98) = 15.86, p < .001. This result suggests it is unlikely that Knowledge Pretest and Knowledge Posttest are produced by distributions with equal variances, indicating the assumption of homogeneity of variance was violated.
Results
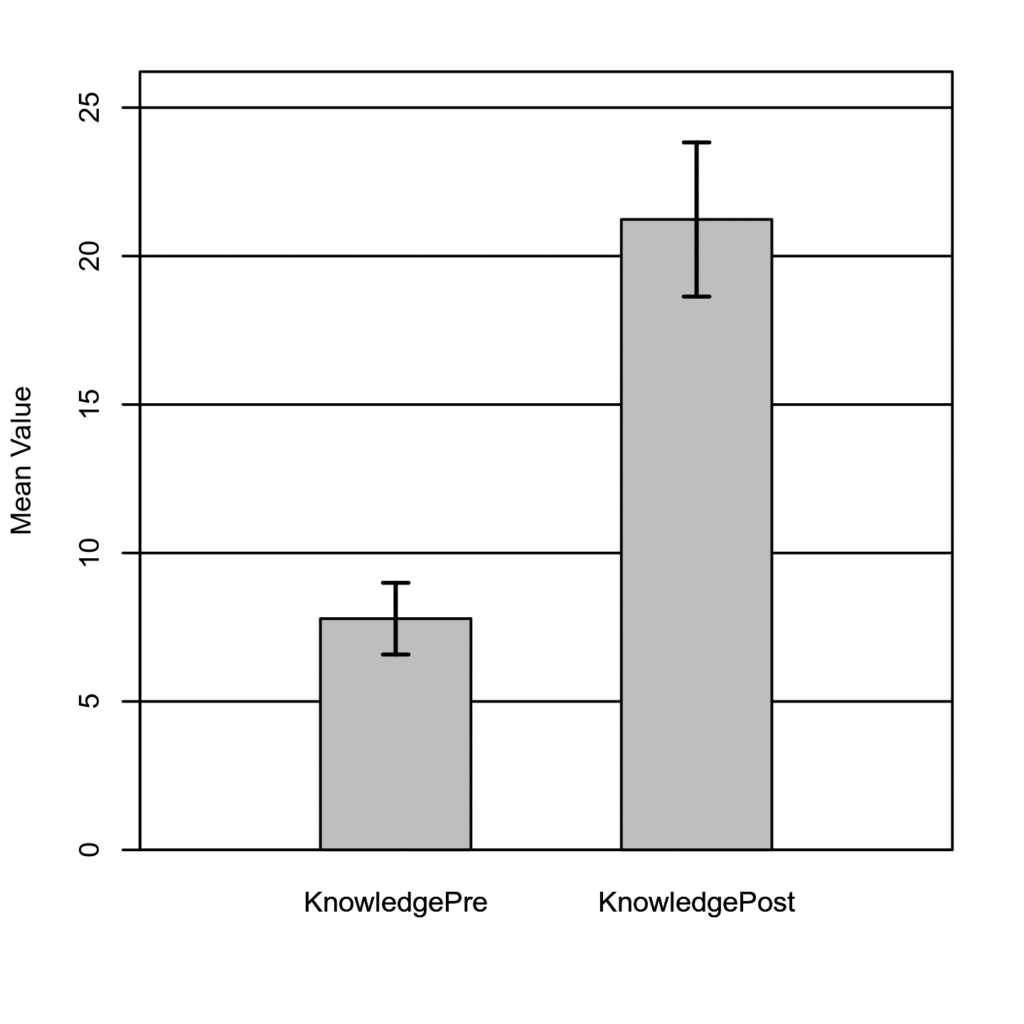
The result of the two-tailed paired samples t-test is significant based on an alpha value of 0.05, t(49) = -12.20, p < .001, indicating the null hypothesis can be rejected. This finding suggests the difference in the mean of Knowledge Pretest and the mean of Knowledge Posttest is significantly different from zero. The mean of Knowledge Pretest was significantly lower than the mean of Knowledge Posttest. Find the results in Table 1 and a bar plot of the means in Figure 1.
Table 1
Two-Tailed Paired Samples t-Test for the Difference Between Knowledge Pretest and Knowledge Posttest
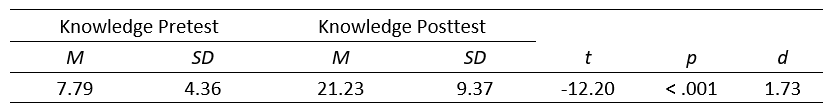
Note. N = 50. Degrees of Freedom for the t-statistic = 49. d represents Cohen’s d.
Figure 1
The means of Knowledge Pretest and Knowledge Posttest with 95% CI Error Bars
The next step is to take the same statistical test with different data and provide students with only the raw output view. The students must then interpret and write-up the results, create the appropriate tables and figures, and reference the assumptions. Below is the raw output view of a paired t-test.
Two-Tailed Paired Samples t-Test: Raw Output View
Paired t-Test for Knowledge Pretest and Knowledge Posttest
The students can then independently do a knowledge check by comparing their write-up to the interpreted output view and edit as necessary. Faculty can use the numerous datasets to allow the students to practice, practice, practice.
Intellectus Statistics and its Autodrafting technology offer a different mode of learning and teaching. Students who use Intellectus are much less frustrated when they see that an analysis includes easily digested data. They gain the skill of writing the results themselves as well as the competence and confidence to conduct data analyses without being a statistician.